NIFTY VIEW short term as well as long term.
I have used monthly spot nifty chart and plotted following parameter
> upper window — Monthly spot nifty with super imposed with swing reversal of 5 %
> This indicates that upswing started from 7511.10 to 15915.65 in 16th month with a gain of 8404.55 points advance or 111.90% gain
> Below high low bar chart next is RSI normal indicator with input value as No of Months advance from the low made Inclusive of
the start.
> A lower window is also plotted modified RSI of my input to find change in trend to time the market.
Now following observation seen.
Case 1: Nifty upward trend started from low 7511.10 on March 2020 since then the nifty value value is inching upward.
In normal RSI and input value changed to the no of month of uptrend to find the trend is matured on not??
Now the value of RSI value is placed at 67.18 As per RSI Principe the value of 70 is considered as OB and value of 30 is considered as OS. So as per the normal RULE we are in OB area and need to be caution in uptrend.
>> Also current trend and month of JULY is trading below the open of 15839 indicators RED signal as current value is below open
Alert: this is not a view to exit immediately but indicating that
avoid long and keep booking profit on every advance to protect
your capital.
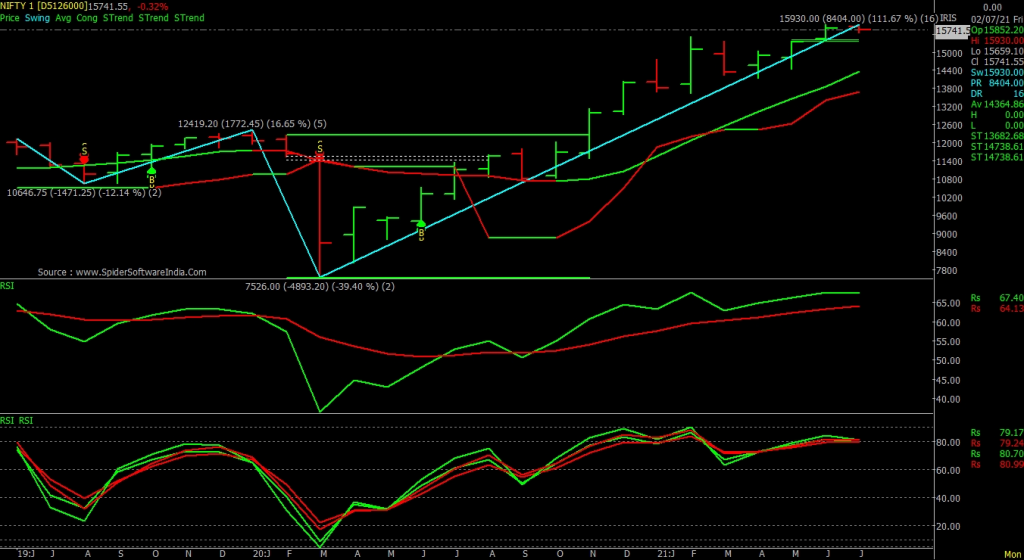
Case 2: My modified RSI made a top when nifty Feb 2021 at 15431 spot value when my RSI made a top value of 90.41. Making perfect indication that as RSI has made a new high we must observe a negative divergence to render or indicate
change in trend…………… is this is coming now??
Are we progressing in change of trend??
since i observe negative divergence in modified RSI whie Normal RSI has turned
down and its EMA is also mildly breached and bearish crossover made (since normal
RSI has made new value so there are chance to make new high for divergence but
in that case also to make negative divergence we need to give one decline also.
>> As long as nifty spot is trading below its critical lvl of 15840 will not Initiate long and will wait for fresh long
>> Important lvl for making long would be 15935 above that only 16047 – 16165. >> fresh weakness will be 15682 – 15622 – 15586 – 15522 and last LOC is 15460
| TOP 5 FO GAINERS ARE | TOP 5 FO WEAK STOCK |
| 1) NAUKRI | 1) IDEA, |
| 2) DABUR | 2) PFC |
| 3) DEEPAK NITRITE | 3) SAIL |
| 4) BEL | 4) BAJAFINSERVE |
| 5) tDR REDDY | 5) REC |
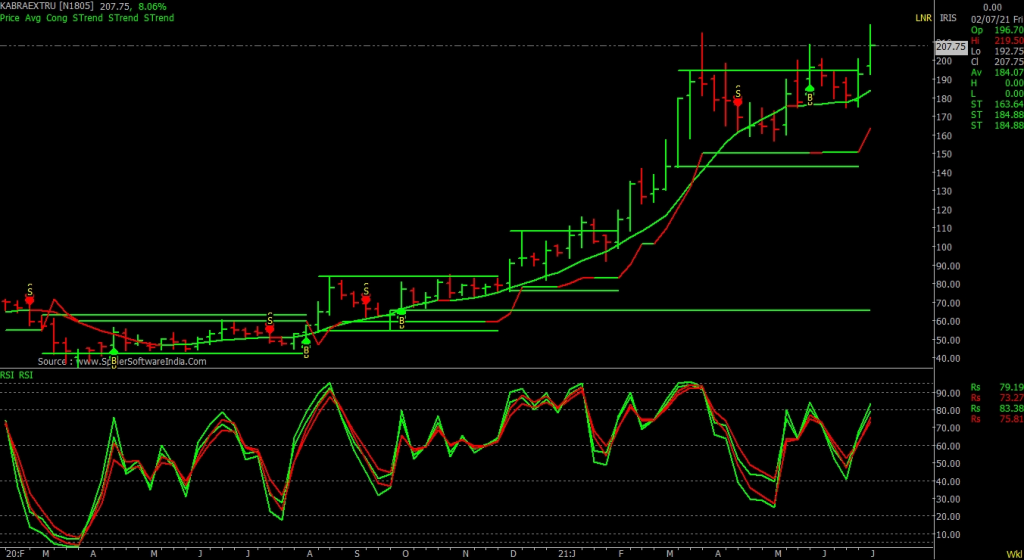
KABRA EXT RS 207.75
Here i have presented weekly chart of this company.
- Chart indicates that it has come out from consolidation phase and now entering in fresh up trend.
- Also its 10 week SMA is now turned upward indicating that stock is ready for explosive upside.
- Suggested to buy with a due stop order of below Rs 190
- Probable TGT would be Rs 220 — 233 – 247.
- Time period 2 to 3 weeks’ time
PREMEXPLOSIVE RS 185
- Stock is presented here in weekly time frame and it is closed above last 24th month consolidation.
- Stock is expected to gain more upside and during last week it has closed up 21.46%
Chart pattern and indicator looks very good. - Also last week it has showed highest volume observed.
- Buy at CMP at Rs 185 and in the range of Rs 185 to Rs 165
- Close above Rs 190 price can move up to Rs 215 – 240 – 255
Time period 2 to 4 weeks’ time.